Global Vineyard Surface Area

Total area of land planted with grape-bearing vines worldwide
Significance of global vineyard surface area
Global vineyard surface area reflects the total area of land dedicated to growing vines for all purposes including wine. The 25 year view shows a decline in vineyard surface area which is leading to a decrease in the production capacity of the wine industry. Production capacity decreases can impact global wine supply, demand and consumer prices. Additionally, the total area of vineyards can provide insights into the health of the wine industry such as industry consolidation, small vs. large vineyard ratio and trends of production costs and quality.
25 Year View
Summary
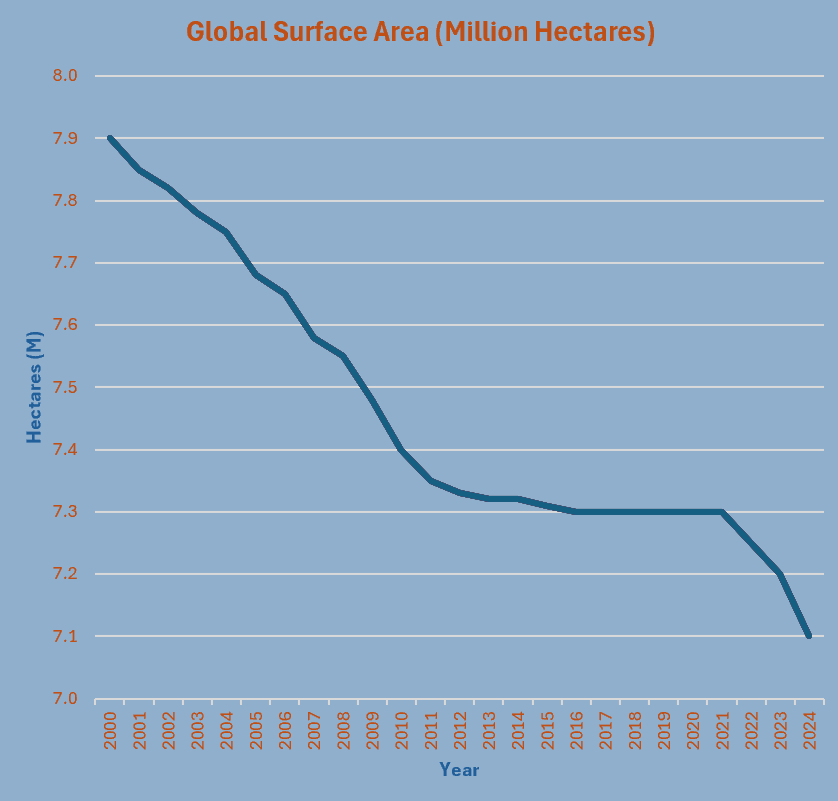
Global vineyard surface area has declined ~10% since 2000 (from ~7.9 to 7.1 million hectares
2024 compared to 2023, Vineyard Surface Area continued its decline contracting by 0.6% to 7.1 million hectares year over year in major vine-growing regions in both hemispheres. This marks the fourth consecutive year of decline.
The decline / contraction is slow and steady, with a long plateau around 7.3 million hectares from 2010–2021
2024 marks the lowest level in decades, confirmed by OIV, driven by vineyard removals across major regions
Surface Area Decline - Structural drivers:
EU grubbing‑up programs (removal of old vines or vineyards to improve vineyard health, yield or adapt to changing market demands)
Declining wine consumption in Europe
Climate‑driven disease pressure (especially 2023–24)
China’s vineyard contraction
Rising but insufficient growth in India, Brazil, and parts of Latin America
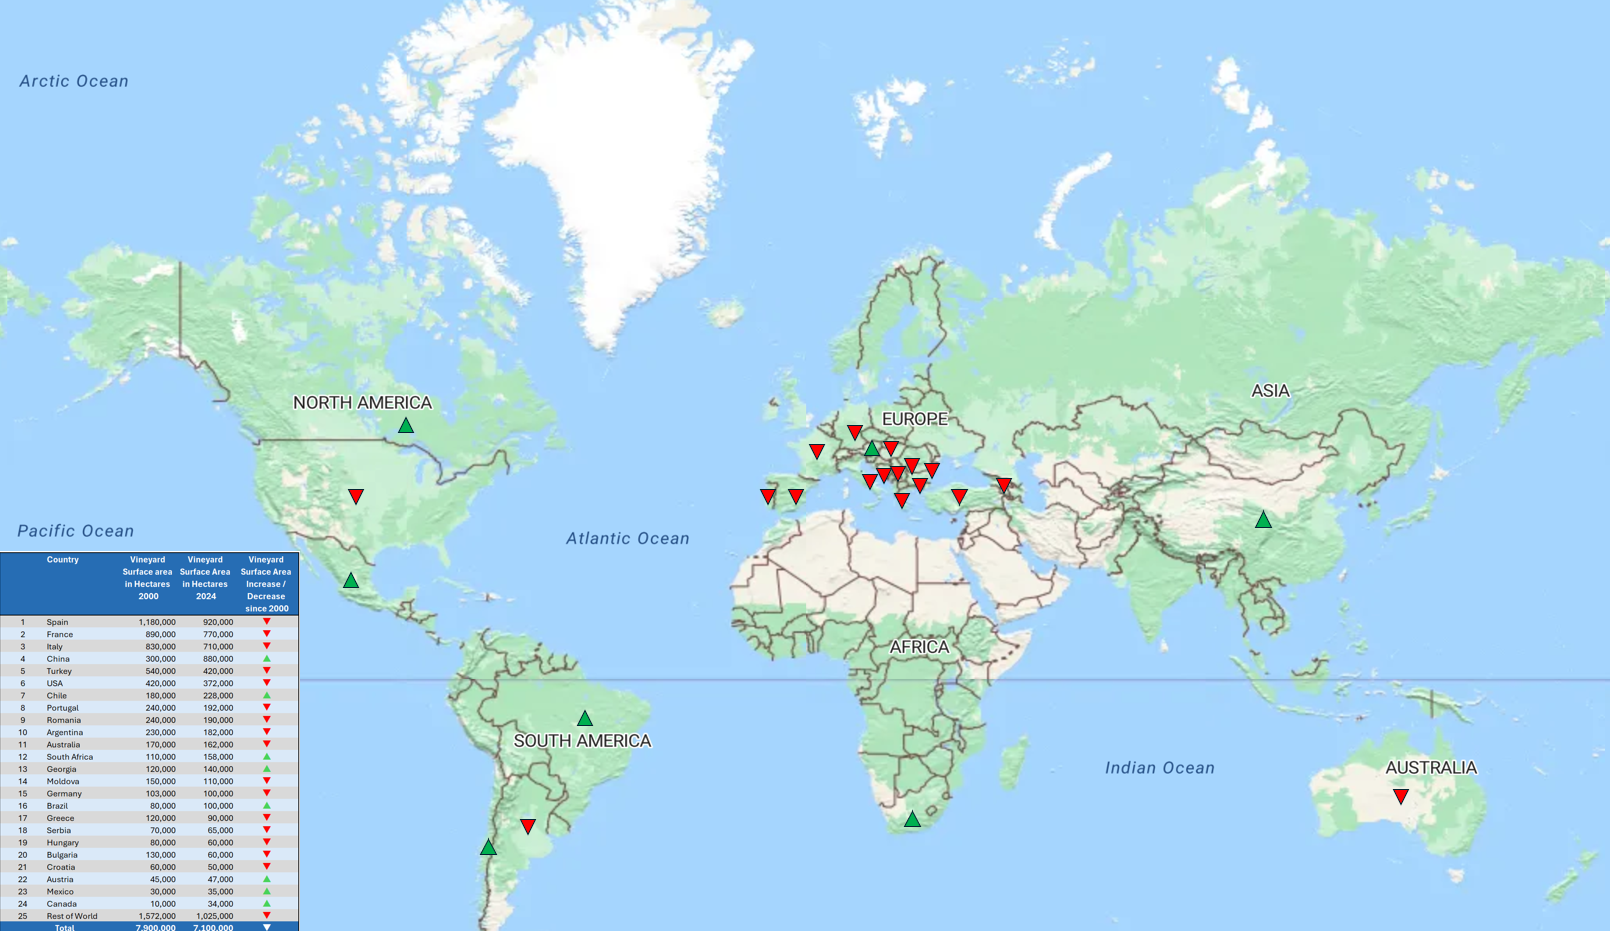
Vineyard Surface Area Map
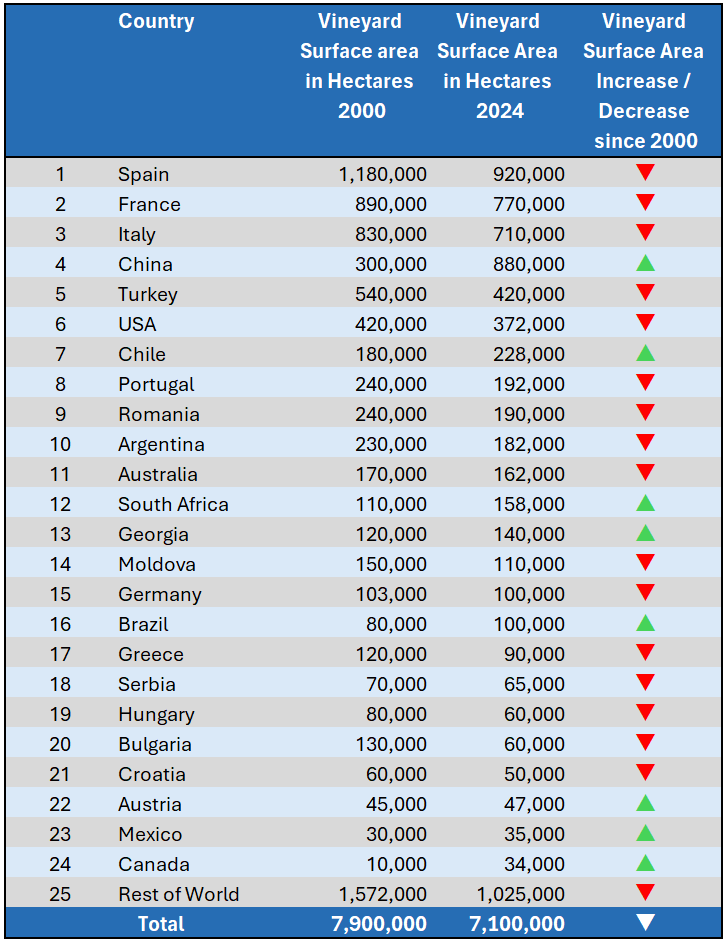
25 Top Wine Producing Countries
Surface Area Chart
Top 25 Wine Producers
Analysis
Spain, France, Italy, Portugal → long, slow decline/contactions of vineyards
EU grubbing‑up programs
Lower‑value vineyard removal
Climate‑driven disease pressure
Despite shrinking area, value per hectare is rising (premiumization).
China One of the most dramatic vineyard expansions in modern history (2000–2015). Plateau and slight contraction after 2018 due to:
Shifts in domestic demand
Profitability pressures
Table‑grape sector adjustments
USA Stable with slight optimization (380–420 kha)
California dominates
climate stress is shifting plantings northward and to higher altitudes
South Africa Stable to slightly declining.
Water constraints and market pressures shape planting decisions.
Canada Small but steadily growing.
Growth concentrated in Okanagan, Niagara Peninsula and Nova Scotia (fastest‑growing cool‑climate region) .
Latin America (Chile, Argentina) - Mild contraction as producers focus on:
Higher‑altitude sites
Premiumization
Export‑market shifts
Others → absorbs residual to match global totals