Industry statistics to grow your business

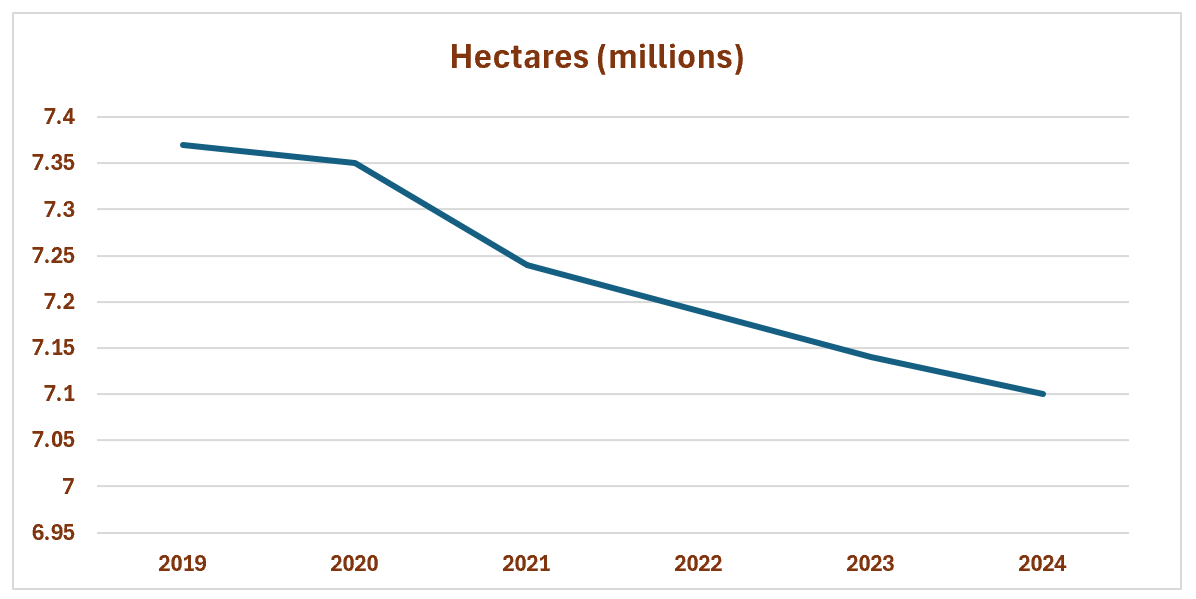
Global Vineyard Surface Area

Vineyard with rows of grapevines and wooden posts, green landscape, and cloudy sky.
Line graph showing the decrease in hectares in millions from 2019 to 2024. The value starts around 7.38 in 2019 and declines to about 7.09 in 2024.

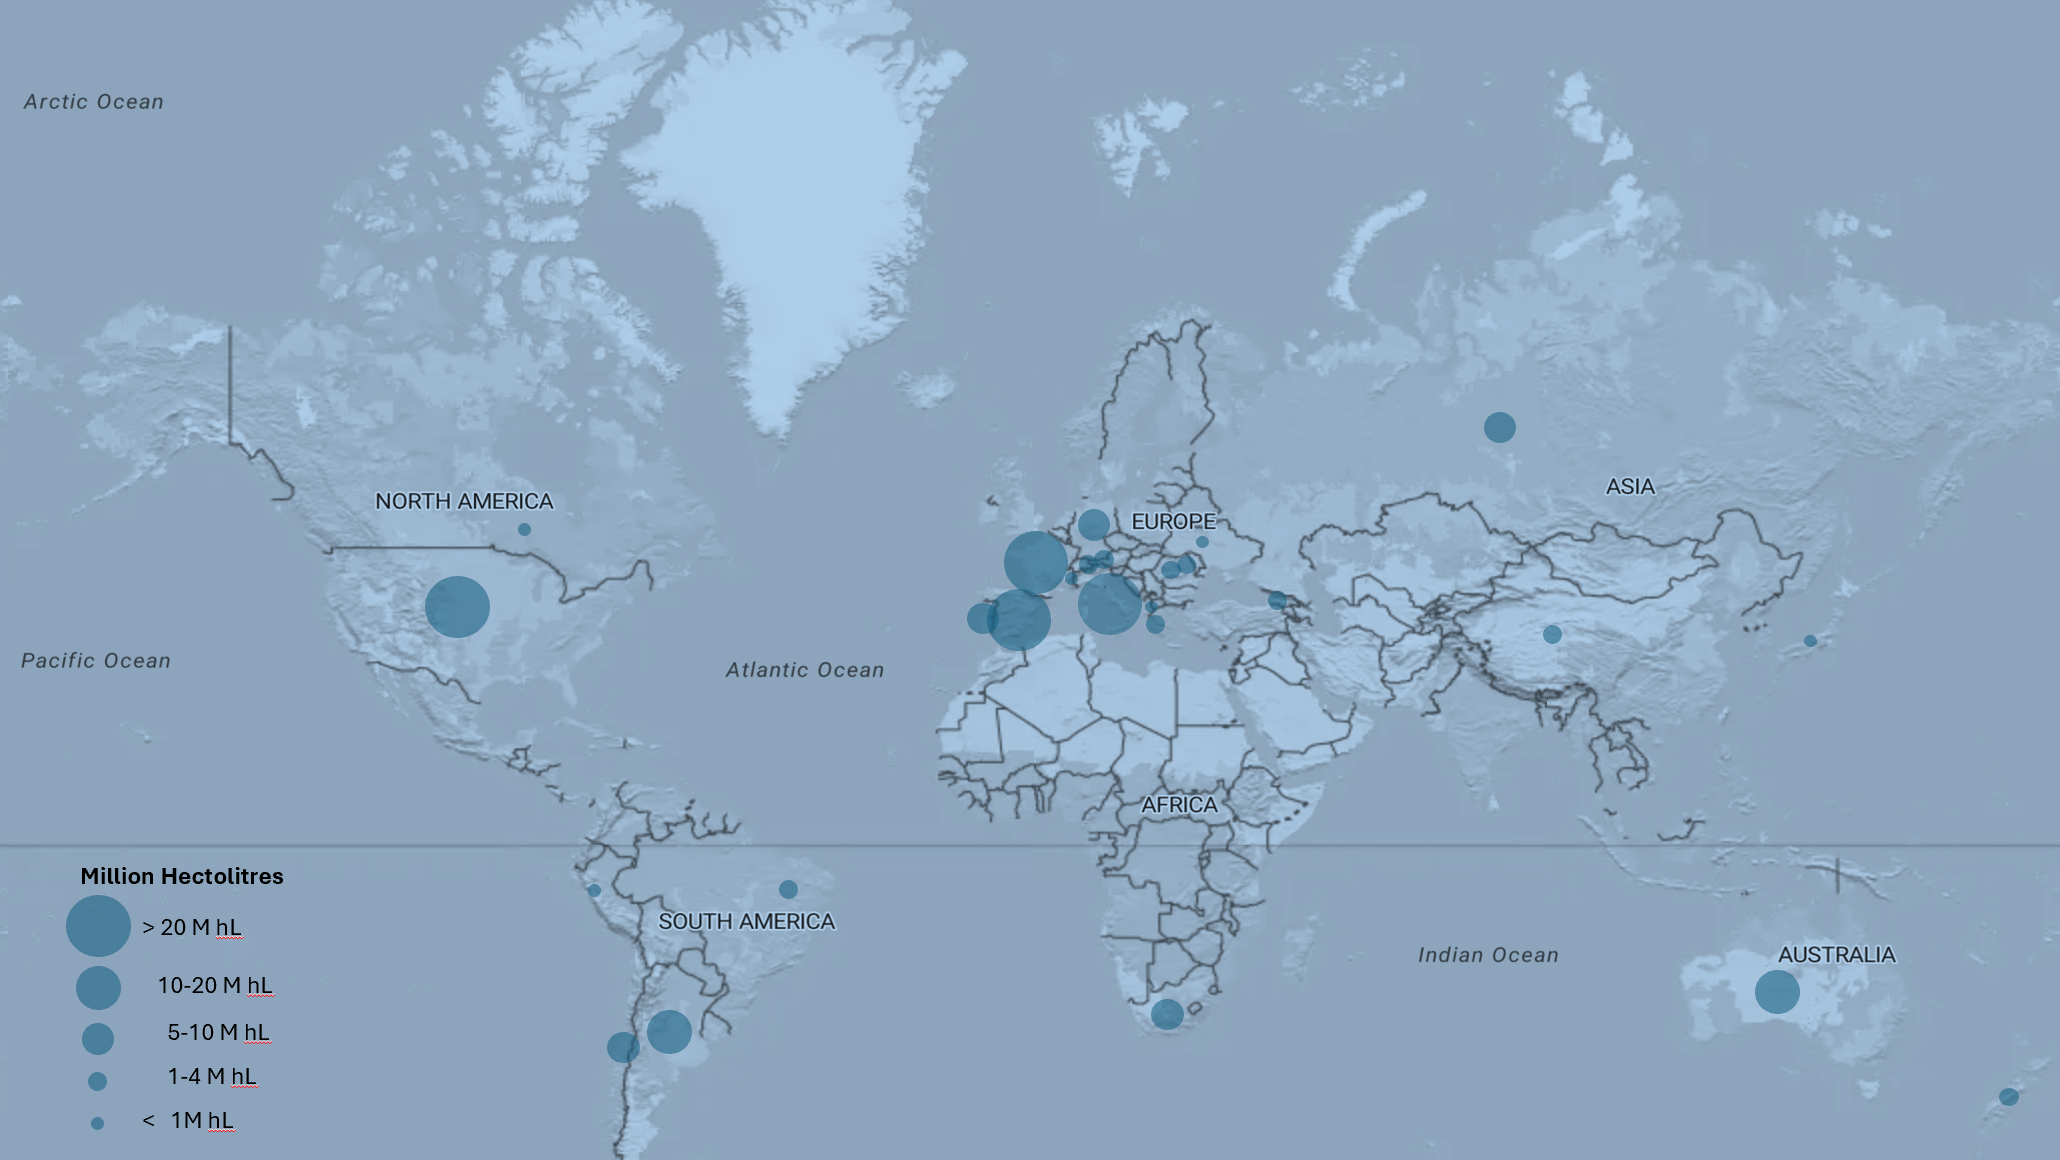
Global Wine Consumption

Wine barrels stored in a cellar with stone walls and wooden beams.
Table showing production data for various countries in hectoliters, liters, and bottles of 750mL. Italy leads in all categories, followed by France, Spain, and the United States.

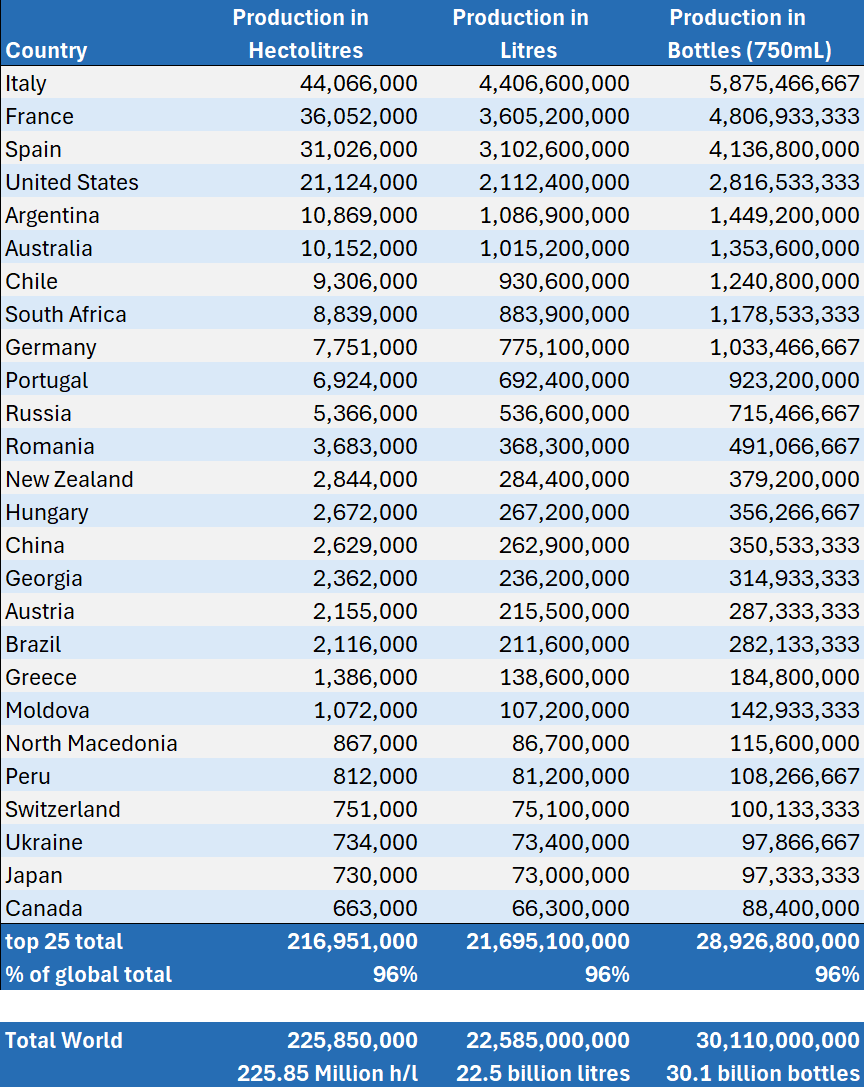
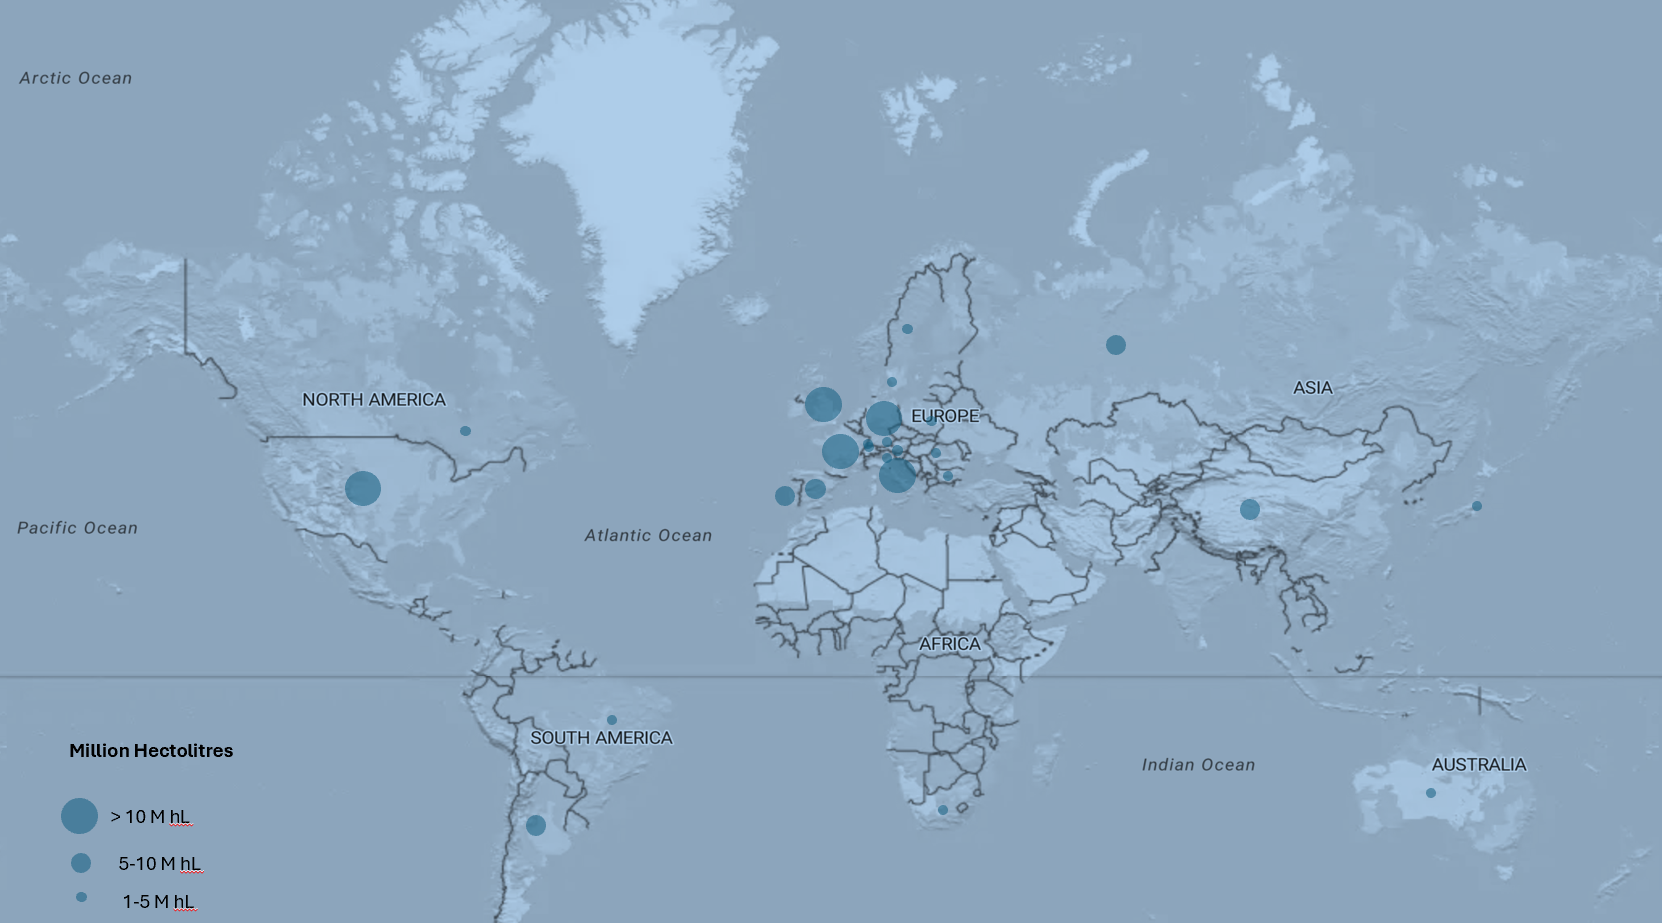
Global Wine Production

Two glasses of red wine being held in front of a bar with blurred bottles in the background.
World map showing locations of landmasses and oceans, with circles of different sizes indicating the million hectolitres, from over 10 million to 1-5 million, in various regions including North America, South America, Europe, Africa, Asia, Australia, and islands.

Opportunity Landscape and Emerging Markets

A world map showing global hydrogen production in million hectoliters. Larger blue circles represent higher production, with a key indicating circle sizes for over 20 million, 10-20 million, 5-10 million, 1-4 million, and less than 1 million hectoliters. Countries with significant production are marked across Europe, North America, South America, Africa, Asia, and Australia.

*This page is password protected. Please contact Vin Amator for access. Link Below.

Contact Us

For password to Industry Statistics details, please fill form to the right. Thank you.